Types Of Data & Graphs for Data Analysis
Once the Goal of the research is determined, the next step in the lifecycle of Data Science is Data Retrieval, which can be captured from many sources and in many forms. Once the Data is captured, we verify the types of Data or Variables, or instances we have in a dataset.
1.)
Categorical
2.)
Numerical
Categorical Data Type is the variables which forms a
category, or groups such as Gender, or a variable that has an answer as Yes/No.
they usually take fixed number of possible values. A categorical variable that
can take exactly two values is also known as binary variable or dichotomous
variable, and the one with more than two variables is known as polytomous
variable.
The Data can be further categorized as Nominal and
Ordinal Data type. Nominal variable is the one that has no particular order and
Ordinal Variable has a particular order.
Numerical Data type deals with the numbers. It is further divided into Discrete and Continous data type. Discrete variable has a fixed value such as number of children or it takes only a whole number whereas Continous may take any number and can be best explained as the weight of a population. Weight can be of any values such as 45.5 kgs and thus this data is Continous Data.
Graphs
for the Data
Different data types can be visualized using different graphs, We will first deal with Categorical Data type, A variable that is of a categorical nature can be visualize using
1.) BAR
Graphs
2.) Frequency
Distribution graphs
3.) Pareto
Chart
4.) Pie
Charts
Numerical Data Types can be visualize using
1.) Histogram
2.) Box Plots
Measuring the
Relationship between two Variables
There
are cases when we want to analyse the relationship between the variables in
Data sets, then we use
1.)
Scatterplots
2.) Cross Tables/ Contingency Tables
BAR Graphs
A Bar Chart is a graph used to represent the categorical data. It has rectangle bars plotted vertically/horizontally. Vertical bar charts are also referred as Column Bar Chart. The bar charts compares the categories and groups among discrete data types or counts of each category.
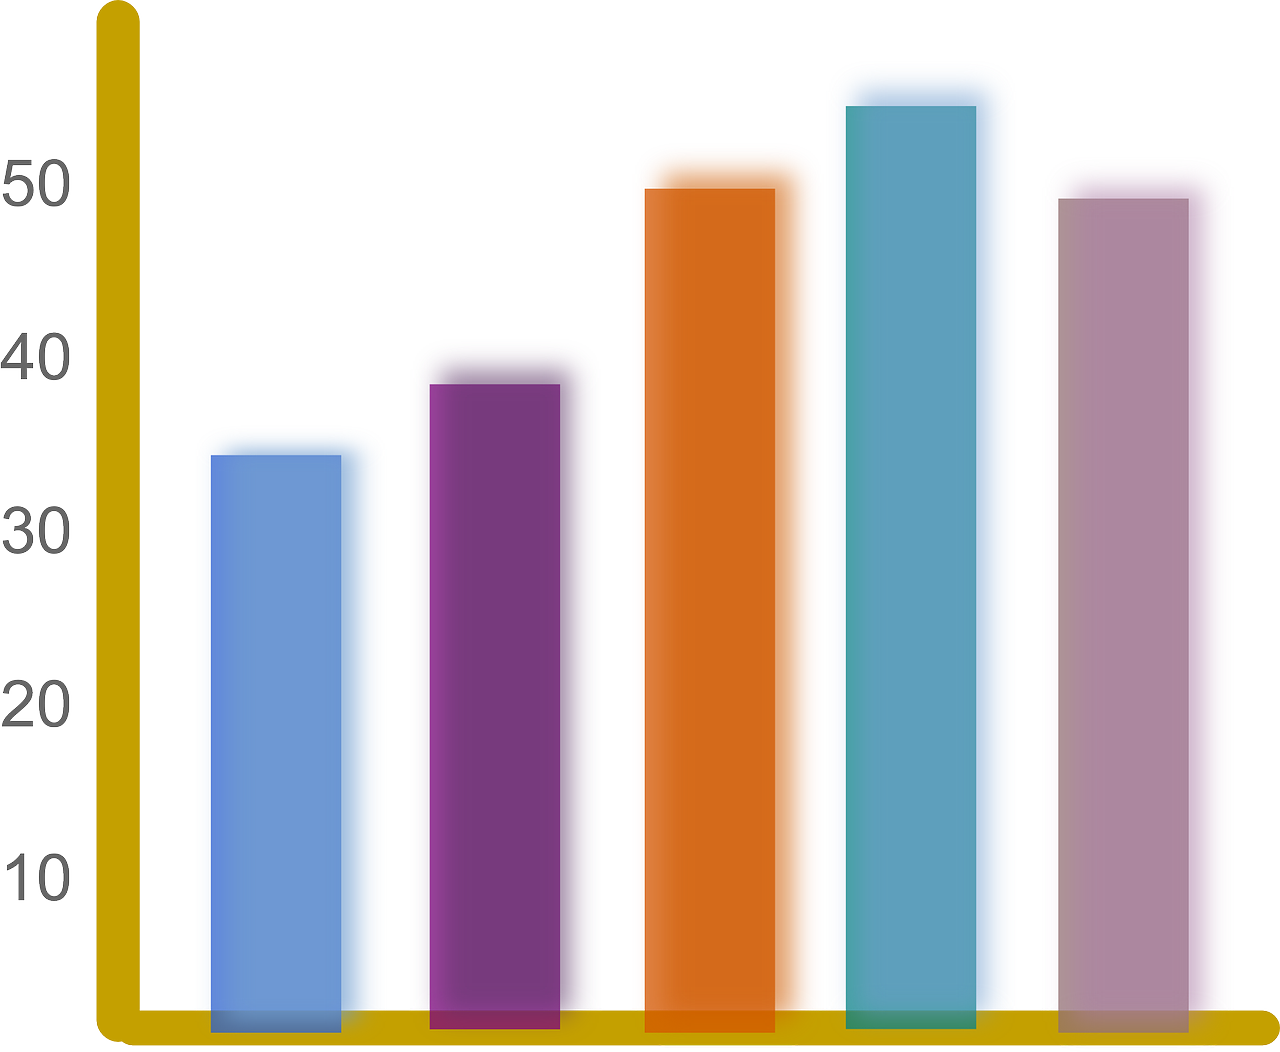
A Bar Chart
Image by OpenClipart-Vectors from Pixabay
Frequency
Distribution Charts
A
frequency distribution table/chart/graph is a list of samples with their
respective frequencies. Each entry in the table has list of frequencies of a
sample. Frequency Tables Can be of Two Types
Univariate
Frequency table(Single Variable Frequency Table)
The Table contains the name of the dog breeds and number of pets.

Bi-Variate
Frequency table/Joint frequency Distribution is presented as two way
contingency tables(cross tables). The below tables shows the investment made by different individuals in Stocks And Bonds.
|
|
Asim Syed |
Pratiksha |
Megha |
Pankaj |
|
Stocks |
20 |
5 |
10 |
20 |
|
Bonds |
10 |
25 |
10 |
10 |
Pareto Charts
Pareto
charts contains both bar graph and line- graph, where individual values are
represented in descending order by bars, and the cumulative total is
represented by line chart. The left vertical axis represents frequency and the
right vertical axis is the cumulative percentage of the total number of occurrences.
It is based on Pareto Principle which states that 80% consequences comes from
20% causes and it is also called 80/20 rule.

Pie Charts
Pie Charts are a circular statistical tool which is used to visualize the share/proportion/relative frequency of each category. They are usually avoided and you will see less of them while doing Data Analysis.

Histograms
Histograms
are used to visualize the numerical data. The most important thing in histogram
is the bins, buckets or range of values. It was introduced by Karl Pearson. We
divide the entire range of values in intervals and then count frequency
corresponding to each interval. The bins are consecutive, non-overlapping
intervals of variables.
We
calculate the Interval width = Max – Min/ No of Required Bins.\

Box Plots
Box Plot is used to represent numerical data graphically. We can easily check outliers,box plots are non-parametric. They display five-number summary
Minimum (Q0 percentile)
Maximum (Q4 percentile)
Median (Q2 percentile)
First Quartile (Q1 percentile 25th percentile)
Third Quartile (Q3 percentile 75th percentile)

Scatter
Plots
Scatter
plots are used to show the relationship two numerical variable for a dataset.
If the points are coded as color, another variable can also be used. It
illustrates the correlation between the two variables.


Comments
Post a Comment